
NCERT Solutions for Class 9 Maths Chapter 14 Statistics| PDF Download
In this page, you will find NCERT Solutions for Chapter 14 Statistics Class 9 Maths which are accurate and detailed are prepared by Studyrankers experts. Here, you can download PDF of Class 9 Maths NCERT Solutions of Chapter 14 Statistics which will make you aware of the difficulty of questions. You can also complete your homework on time through the help of these NCERT Solutions and increase your concentration.
Class 9 Maths NCERT Solutions presented here are very helpful in developing problem solving skills and prepare for the examinations. These NCERT solutions are prerequisites before solving exemplar problems and going for supplementary Maths Books.

Exercise 14.1
1. Give five examples of data that you can collect from your day-to-day life.
Answer
Five examples from day-to-day life:
(i) Daily expenditures of household.
(ii) Amount of rainfall.
(iii) Bill of electricity.
(iv) Poll or survey results.
(v) Marks obtained by students.
2. Classify the data in Q.1 above as primary or secondary data.
Answer
Primary Data: (i) (iii) and (v)
Secondary Data: (ii) and (iv)
Page No: 245
Exercise 14.2
1. The blood groups of 30 students of Class VIII are recorded as follows:
A, B, O, O, AB, O, A, O, B, A, O, B, A, O, O,
A, AB, O, A, A, O, O, AB, B, A, O, B, A, B, O.
Represent this data in the form of a frequency distribution table. Which is the most common, and which is the rarest, blood group among these students?
Answer
The frequency means the number of students having same blood group. We will represent the data in table:
| Blood Group | Number of Students
(Frequency)
|
| A | 9 |
| B | 6 |
| O | 12 |
| AB | 3 |
| Total | 30 |
Most common Blood Group (Highest frequency): O
Rarest Blood Group (Lowest frequency): AB
2. The distance (in km) of 40 engineers from their residence to their place of work were found as follows:
5 3 10 20 25 11 13 7 12 31
19 10 12 17 18 11 32 17 16 2
7 9 7 8 3 5 12 15 18 3
12 14 2 9 6 15 15 7 6 12
Construct a grouped frequency distribution table with class size 5 for the data given above taking the first interval as 0-5 (5 not included). What main features do you observe from this tabular representation?
Answer
The given data is very large. So, we construct a group frequency of class size 5. Therefore, class interval will be 0-5, 5-10, 10-15, 15-20 and so on. The data is represented in the table as:

The classes in the table are not overlapping. Also, 36 out of 40 engineers have their house below 20 km of distance.
3. The relative humidity (in %) of a certain city for a month of 30 days was as follows:
98.1 98.6 99.2 90.3 86.5 95.3 92.9 96.3 94.2 95.1
89.2 92.3 97.1 93.5 92.7 95.1 97.2 93.3 95.2 97.3
96.2 92.1 84.9 90.2 95.7 98.3 97.3 96.1 92.1 89
(i) Construct a grouped frequency distribution table with classes 84 - 86, 86 - 88, etc.
(ii) Which month or season do you think this data is about?
(iii) What is the range of this data?
Answer
(i) The given data is very large. So, we construct a group frequency of class size 2. Therefore, class interval will be 84-86, 86-88, 88-90, 90-92 and so on. The data is represented in the table as:
| Relative humidity (in %) | Frequency |
| 84-86 | 1 |
| 86-88 | 1 |
| 88-90 | 2 |
| 90-92 | 2 |
| 92-94 | 7 |
| 94-96 | 6 |
| 96-98 | 7 |
| 98-100 | 4 |
| Total | 30 |
(ii) The humidity is very high in the data which is observed during rainy season. So, it must be rainy season.
(iii) Range of data = Maximum value of data - Minimum = 99.2 − 84.9 = 14.3
4. The heights of 50 students, measured to the nearest centimetres, have been found to be as follows:
161 150 154 165 168 161 154 162 150 151
162 164 171 165 158 154 156 172 160 170
153 159 161 170 162 165 166 168 165 164
154 152 153 156 158 162 160 161 173 166
161 159 162 167 168 159 158 153 154 159
(i) Represent the data given above by a grouped frequency distribution table, taking the class intervals as 160 - 165, 165 - 170, etc.
(ii) What can you conclude about their heights from the table?
Answer
(i) The data with class interval 160-165, 165-170 and so on is represented in the table as:
| Height (in cm) | No. of Students (Frequency) |
| 150-155 | 12 |
| 155-160 | 9 |
| 160-165 | 14 |
| 165-170 | 10 |
| 170-175 | 5 |
| Total | 50 |
(ii) From the given data, it can be concluded that 35 students i.e. more than 50% are shorter than 165 cm.
5. A study was conducted to find out the concentration of sulphur dioxide in the air in parts per million (ppm) of a certain city. The data obtained for 30 days is as follows:
0.03 0.08 0.08 0.09 0.04 0.17
0.16 0.05 0.02 0.06 0.18 0.20
0.11 0.08 0.12 0.13 0.22 0.07
0.08 0.01 0.10 0.06 0.09 0.18
0.11 0.07 0.05 0.07 0.01 0.04
(i) Make a grouped frequency distribution table for this data with class intervals as 0.00 - 0.04, 0.04 - 0.08, and so on.
(ii) For how many days, was the concentration of sulphur dioxide more than 0.11 parts per million?
Answer
(i) The data with class interval 0.00 - 0.04, 0.04 - 0.08 and so on is represented in the table as:
| Concentration of sulphur dioxide in air
(in ppm)
| Frequency |
| 0.00 − 0.04 | 4 |
| 0.04 − 0.08 | 9 |
| 0.08 − 0.12 | 9 |
| 0.12 − 0.16 | 2 |
| 0.16 − 0.20 | 4 |
| 0.20 − 0.24 | 2 |
| Total | 30 |
Page No. 246
6. Three coins were tossed 30 times simultaneously. Each time the number of heads occurring was noted down as follows:
0 1 2 2 1 2 3 1 3 0
1 3 1 1 2 2 0 1 2 1
3 0 0 1 1 2 3 2 2 0
Prepare a frequency distribution table for the data given above.
Answer
The frequency distribution table for the data given above can be prepared as follow:
| Number of Heads | Frequency |
| 0 | 6 |
| 1 | 10 |
| 2 | 9 |
| 3 | 5 |
| Total | 30 |
7. The value of π upto 50 decimal places is given below:
3.14159265358979323846264338327950288419716939937510
(i) Make a frequency distribution of the digits from 0 to 9 after the decimal point.
(ii) What are the most and the least frequently occurring digits?
Answer
(i)The frequency is given as follow:
| Digits | Frequency |
| 0 | 2 |
| 1 | 5 |
| 2 | 5 |
| 3 | 8 |
| 4 | 4 |
| 5 | 5 |
| 6 | 4 |
| 7 | 4 |
| 8 | 5 |
| 9 | 8 |
| Total | 30 |
(ii) The digit having the least frequency occurs the least and the digit with highest frequency occurs the most. 0 has frequency 2 and thus occurs least frequently while 3 and 9 have frequency 8 and thus occur most frequently.
8. Thirty children were asked about the number of hours they watched TV programmes in the previous week. The results were found as follows:
1 6 2 3 5 12 5 8 4 8
10 3 4 12 2 8 15 1 17 6
3 2 8 5 9 6 8 7 14 12
(i) Make a grouped frequency distribution table for this data, taking class width 5 and one of the class intervals as 5-10.
(ii) How many children watched television for 15 or more hours a week?
Answer
(i) The distribution table for the given data, taking class width 5 and one of the class intervals as 5-10 is as follows:
| Number of Hours | Frequency |
| 0-5 | 10 |
| 5-10 | 13 |
| 10-15 | 5 |
| 15-20 | 2 |
| Total | 30 |
(ii) We observed from the given table that 2 children television for 15 or more hours a week.
9. A company manufactures car batteries of a particular type. The lives (in years) of 40 such batteries were recorded as follows:
2.6 3.0 3.7 3.2 2.2 4.1 3.5 4.5
3.5 2.3 3.2 3.4 3.8 3.2 4.6 3.7
2.5 4.4 3.4 3.3 2.9 3.0 4.3 2.8
3.5 3.2 3.9 3.2 3.2 3.1 3.7 3.4
4.6 3.8 3.2 2.6 3.5 4.2 2.9 3.6
Construct a grouped frequency distribution table for this data, using class intervals of size 0.5 starting from the interval 2 - 2.5.
Answer
A grouped frequency distribution table using class intervals of size 0.5 starting from the interval 2 - 2.5 is constructed.
| Lives of batteries (in years) | No. of batteries (Frequency) |
| 2-2.5 | 2 |
| 2.5-3 | 6 |
| 3-3.5 | 14 |
| 3.5-4 | 11 |
| 4-4.5 | 4 |
| 4.5-5 | 3 |
| Total | 40 |
Page No. 258
Exercise 14.3
1. A survey conducted by an organisation for the cause of illness and death among the women between the ages 15 - 44 (in years) worldwide, found the following figures (in %):
| S.No. | Causes | Female fatality rate (%) |
| 1. | Reproductive health conditions | 31.8 |
| 2. | Neuropsychiatric conditions | 25.4 |
| 3. | Injuries | 12.4 |
| 4. | Cardiovascular conditions | 4.3 |
| 5. | Respiratory conditions | 4.1 |
| 6. | Other causes | 22.0 |
(i) Represent the information given above graphically.
(ii) Which condition is the major cause of women’s ill health and death worldwide?
(iii) Try to find out, with the help of your teacher, any two factors which play a major role in the cause in (ii) above being the major cause.
Answer
(i) The data is represented below graphically.

(ii) From the above graphical data, we observe that reproductive health conditions is the major cause of women’s ill health and death worldwide.
(iii) Two factors responsible for cause in (ii)
• Lack of proper care and understanding.
• Lack of medical facilities.
2. The following data on the number of girls (to the nearest ten) per thousand boys in different sections of Indian society is given below.
| S.No. | Section | Number of girls per thousand boys |
| 1. | Scheduled Caste (SC) | 940 |
| 2. | Scheduled Tribe (ST) | 970 |
| 3. | Non SC/ST | 920 |
| 4. | Backward districts | 950 |
| 5. | Non-backward districts | 920 |
| 6. | Rural | 930 |
| 7. | Urban | 910 |
(i) Represent the information above by a bar graph.
(ii) In the classroom discuss what conclusions can be arrived at from the graph.
Answer
(i)

(ii) It can be observed from the above graph that the maximum number of girls per thousand boys is in ST. Also, the backward districts and rural areas have more number of girls per thousand boys than non-backward districts and urban areas.
Page No. 59
3. Given below are the seats won by different political parties in the polling outcome of a state assembly elections:
| Political party | A | B | C | D | E | F |
| Seats won |
75
|
55
|
37
|
29
|
10
|
37
|
(ii) Which political party won the maximum number of seats?
Answer
(i)

(ii) The party named A has won the maximum number of seat.
4. The length of 40 leaves of a plant are measured correct to one millimetre, and the obtained data is represented in the following table:
| S.No. | Length (in mm) | Number of leaves |
| 1. | 118 - 126 | 3 |
| 2. | 127 - 135 | 5 |
| 3. | 136 - 144 | 9 |
| 4. | 145 - 153 | 12 |
| 5. | 154 - 162 | 5 |
| 6. | 163 - 171 | 4 |
| 7. | 172 - 180 | 2 |
(i) Draw a histogram to represent the given data. [Hint: First make the class intervals continuous]
(ii) Is there any other suitable graphical representation for the same data?
(iii)Is it correct to conclude that the maximum number of leaves are 153 mm long? Why?
Answer
(i) The data is represented in a discontinuous class interval. So, first we will make continuous. The difference is 1, so we subtract 1/2 = 0.5 from lower limit and add 0.5 to the upper limit.
| S.No. | Length (in mm) | Number of leaves |
| 1. | 117.5 - 126.5 | 3 |
| 2. | 126.5 - 135.5 | 5 |
| 3. | 135.5 - 144.5 | 9 |
| 4. | 144.5 - 153.5 | 12 |
| 5. | 153.5 - 162.5 | 5 |
| 6. | 162.5 - 171.5 | 4 |
| 7. | 171.5 - 180.5 | 2 |

(ii) Yes, the data can also be represented by frequency polygon.
(iii) No, it is incorrect to conclude that the maximum number of leaves are 153 mm long because maximum number of leaves are lying between the length of 144.5 - 153.5
5. The following table gives the life times of 400 neon lamps:
| Life Time (in hours) | Number of lamps |
| 300 - 400 | 14 |
| 400 - 500 | 56 |
| 500 - 600 | 60 |
| 600 - 700 | 86 |
| 700 - 800 | 74 |
| 800 - 900 | 62 |
| 900 - 1000 | 48 |
(ii) How many lamps have a life time of more than 700 hours?
Answer
(i)

(ii) 74 + 62 + 48 = 184 lamps have a life time of more than 700 hours.
Page No. 260
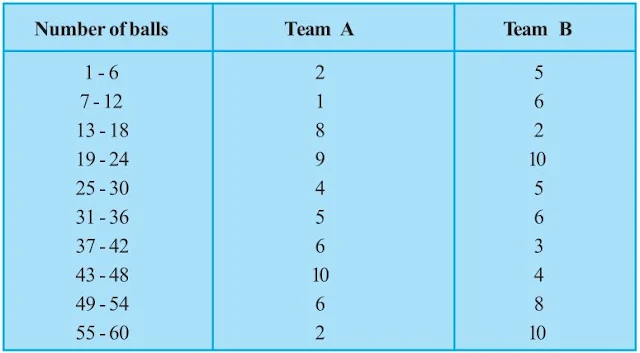
6. The following table gives the distribution of students of two sections according to the marks obtained by them:

Represent the marks of the students of both the sections on the same graph by two frequency polygons. From the two polygons compare the performance of the two sections.
Answer
The class mark can be found by (Lower limit + Upper limit)/2.
For section A,
| Marks | Class Mark | Frequency |
| 0-10 | 5 | 3 |
| 10-20 | 15 | 9 |
| 20-30 | 25 | 17 |
| 30-40 | 35 | 12 |
| 40-50 | 45 | 9 |
For section B,
| Marks | Class Mark | Frequency |
| 0-10 | 5 | 5 |
| 10-20 | 15 | 19 |
| 20-30 | 25 | 15 |
| 30-40 | 35 | 10 |
| 40-50 | 45 | 1 |
Now, we draw frequency polygon for the given data.

[Hint : First make the class intervals continuous.]
Answer
The data is represented in a discontinuous class interval. So, first we will make continuous. The difference is 1, so we subtract 1/2 = 0.5 from lower limit and add 0.5 to the upper limit.
| Number of balls | Team A | Team B |
| 0.5-6.5 | 2 | 5 |
| 6.5-12.5 | 1 | 6 |
| 12.5-18.5 | 8 | 2 |
| 18.5-24.5 | 9 | 10 |
| 24.5-30.5 | 4 | 5 |
| 30.5-36.5 | 5 | 6 |
| 36.5-42.5 | 6 | 3 |
| 42.5-48.5 | 10 | 4 |
| 48.5-54.5 | 6 | 8 |
| 54.5-60.5 | 2 | 10 |
Now, we draw frequency polygon for the given data.

Page No. 261
8. A random survey of the number of children of various age groups playing in a park was found as follows:

Draw a histogram to represent the data above.
Answer
The class intervals in the data is having varying width. We know that the area of rectangle is proportional to the frequencies in the histogram. The class interval with minimum class size 1 is selected and the length of the rectangle is proportionate to it.
| Age (in years) | Number of children (frequency) | Width of class | Length of rectangle |
| 1-2 | 5 | 1 | (5/1)×1 = 5 |
| 2-3 | 3 | 1 | (3/1)×1 = 3 |
| 3-5 | 6 | 2 | (6/2)×1 = 3 |
| 5-7 | 12 | 2 | (12/2)×1 = 6 |
| 7-10 | 9 | 3 | (9/3)×1 = 3 |
| 10-15 | 10 | 5 | (10/5)×1 = 2 |
| 15-17 | 4 | 2 | (4/2)×1 = 2 |
Taking the age of children on x-axis and proportion of children per 1 year interval on y-axis, the histogram can be drawn

9. 100 surnames were randomly picked up from a local telephone directory and a frequency distribution of the number of letters in the English alphabet in the surnames was found as follows:

(i) Draw a histogram to depict the given information.
(ii) Write the class interval in which the maximum number of surnames lie.
Answer
(i) The class intervals in the data is having varying width. We know that the area of rectangle is proportional to the frequencies in the histogram. The class interval with minimum class size 2 is selected and the length of the rectangle is proportionate to it.
The proportion of the surnames per 2 letters interval can be calculated as:
| Number of letters | Number of surnames | Width of class | Length of rectangle |
| 1-4 | 6 | 3 | (6/3)×2 = 4 |
| 4-6 | 30 | 2 | (30/2)×2 = 30 |
| 6-8 | 44 | 2 | (44/2)×2 = 44 |
| 8-12 | 16 | 4 | (16/4)×2 = 8 |
| 12-20 | 4 | 8 | (4/8)×2 = 1 |

Page No. 269
Exercise 14.4
1. The following number of goals were scored by a team in a series of 10 matches:
2, 3, 4, 5, 0, 1, 3, 3, 4, 3
Find the mean, median and mode of these scores.
Answer
Mean = Sum of all the observations/Total number of observations
= (2+3+4+5+0+1+3+3+4+3)/10 = 28/10 = 2.8
For Median, we will arrange the given data in ascending order,
0, 1, 2, 3, 3, 3, 3, 4, 4, 5
Number of observations (n) = 10
Number of observations are even so we will calculate median as,

= (3+3)/2 = 6/2 = 3
For Mode, we will arrange the given data in ascending order, we have
0, 1, 2, 3, 3, 3, 3, 4, 4, 5.
Here, 3 occurs most frequently (4 times)
∴ Mode = 3
2. In a mathematics test given to 15 students, the following marks (out of 100) are recorded:
41, 39, 48, 52, 46, 62, 54, 40, 96, 52, 98, 40, 42, 52, 60
Find the mean, median and mode of this data.
Answer
Mean = Sum of all the observations/Total number of observations
= (41+39+48+52+46+62+54+40+96+52+98+40+42+52+60)/15 = 822/15 = 54.8
For Median, we will arrange the given data in ascending order,
39, 40, 40, 41, 42, 46, 48, 52, 52, 52, 54, 60, 62, 96, 98
Number of observations (n) = 15
Number of observations are odd so we will calculate median as,

For Mode, we will arrange the given data in ascending order, we have
39, 40, 40, 41, 42, 46, 48, 52, 52, 52, 54, 60, 62, 96, 98
Here, 52 occurs most frequently (3 times)
∴ Mode = 52
3. The following observations have been arranged in ascending order. If the median of the data is 63, find the value of x.
29, 32, 48, 50, x, x+2, 72, 78, 84, 95
Answer
Number of observations (n) = 10 (even)

According to question, Median = 63
∴ x + 1 = 63
⇒ x = 63−1 = 62
Hence, the value of x is 62.
4. Find the mode of 14, 25, 14, 28, 18, 17, 18, 14, 23, 22, 14, 18.
Answer
The given data is,
14,25,14,28,18,17,18,14,23,22,14,18
Arranging the data in ascending order,
14,14,14,14,17,18,18,18,22,23,25,28
Here, 14 occurs most frequently (4 times). Mode = 14
5. Find the mean salary of 60 workers of a factory from the following table:

Answer
Salary (xi)
|
Number of workers (fi)
|
fixi
|
| 3000 | 16 | 48000 |
| 4000 | 12 | 48000 |
| 5000 | 10 | 50000 |
| 6000 | 8 | 48000 |
| 7000 | 6 | 42000 |
| 8000 | 4 | 32000 |
| 9000 | 3 | 27000 |
| 10000 | 1 | 10000 |
| Total |
Σfi = 60 | Σfixi = 305000 |

Hence, the mean salary is ₹5083.33
6. Give one example of a situation in which
(i) the mean is an appropriate measure of central tendency.
(ii) the mean is not an appropriate measure of central tendency but the median is an appropriate measure of central tendency.
Answer
(i) Mean marks in a test in mathematics.
(ii) Average beauty
Chapter 14 Statistics Class 9 Maths NCERT Solutions will help you in understanding the concepts in a better way. Statistics deals with collection, organisation, analysis and interpretation of data. It deals with the collection, presentation, analysis of data as well as drawing of meaningful conclusions from the data.
• Collection of Data: When the information was collected by the investigator herself or himself with a definite objective in her or his mind, the data obtained is called primary data. In the second case, when the information was gathered from a source which already had the information stored, the data obtained is called secondary data.
• Presentation of Data: Presenting data in this form simplifies and condenses data and enables us to observe certain important features at a glance. This is called a grouped frequency distribution table.
• Graphical Representation of Data: The graphical representation makes data easier to understand than the actual data. Bar graphs, Histograms of uniform width, and of varying widths and Frequency polygons are some of the graphical representations in this section.
• Measures of Central Tendency: The mean (or average) of a number of observations is the sum of the values of all the observations divided by the total number of observations. The median is that value of the given number of observations, which divides it into exactly two parts.
There are total 4 exercises in the Chapter 14 Statistics NCERT Solutions which will useful in developing your problem solving skills and learning diverse topics. We have also prepared exercisewise NCERT Solutions which you can find them below.
Studyrankers subject matter experts have curated these questions which will help in revising the chapter properly. These NCERT Solutions will guide student in a better way and useful in learning efficiently.
NCERT Solutions for Class 9 Maths Chapters:
FAQ on Chapter 14 Statistics
What are the benefits of NCERT Solutions for Chapter 14 Statistics Class 9 NCERT Solutions?
What are the benefits of NCERT Solutions for Chapter 14 Statistics Class 9 NCERT Solutions?
These NCERT Solutions are updated as per the latest guidelines introduced by CBSE and will improve the learning behaviour of the students. It will be quite helpful in gaining good marks in the examinations.
Find the range of the data 9, 7, 5, 7, 9, 9, 6, 18, 9 and 8.
Find the range of the data 9, 7, 5, 7, 9, 9, 6, 18, 9 and 8.
Highest data = 18
Lowest data = 5
⇒ Range = 18 – 5 = 13.
What do you mean by grouped data?
What do you mean by grouped data?
The data condensed into groups or classes are called grouped data.
What is the class-mark of the class 130 – 150?
Class-mark = ((130+150)/2)
= (280/2)
= 140.
