Extra Questions Answers for Class 6 Maths Chapter 4 Data Handling and Presentation - Ganita Prakash
Chapter 4 Data Handling and Presentation Extra Questions Answers for Class 6 Maths is provided here by studyrankers. All the questions are crafted by our experts by keeping in mind that all the important points must be covered. You can also Download PDF of Class 6 Maths Chapter 4 Data Handling and Presentation Extra Questions which will boost the student confidence and help in solving the exercises and questions from the chapter. The chapter is taken from the new NCERT Mathematics textbook, Ganita Prakash.
These Revision Notes for Class 6 Maths will develop you understanding of the chapter and help in gaining good marks in the examinations. We have also provided Chapter 4 Data Handling and Presentation NCERT Solutions which will help you in completing your homework on time. These NCERT Solutions will help an individual to increase concentration and you can solve questions of supplementary books easily. Students can also check Revision Notes for Data Handling and Presentation Class 6 Maths to prepare for their examination completely.
Important Questions for Chapter 4 Data Handling and Presentation Class 6 Maths
Multiple Choice Questions
Question 1. What is data primarily used for?
(a) Entertainment
(b) Collecting facts and numbers
(c) Cooking
(d) None of the above
Answer
(b) Collecting facts and numbers
Question 2. Which of the following is a visual representation of data?
(a) Pictograph
(b) List
(c) Paragraph
(d) All of the above
Answer
(a) Pictograph
Question 3. What does a bar graph represent?
(a) Numerical values
(b) Qualitative data
(c) Textual information
(d) None of the above
Answer
(a) Numerical values
Question 4. In a pictograph, each picture can represent:
(a) One item only
(b) Multiple items
(c) Only data points
(d) None of the above
Answer
(b) Multiple items
Question 5. What is the key function of infographics?
(a) To confuse the reader
(b) To present data in a visually engaging way
(c) To provide lengthy explanations
(d) None of the above
Answer
(b) To present data in a visually engaging way
Fill in the Blanks
Question 1. Navya collected data on her classmates' favourite fruits. She found that 8 students liked apples, 12 liked bananas, and 5 liked oranges. The total number of students she surveyed is _______.
Answer
25
The total number is found by adding the number of students who liked each fruit: 8 + 12 + 5 = 25.
Question 2. A pictograph uses 1 symbol to represent 5 students. If 4 symbols are used to show the number of students who like chocolate, then _______ students like chocolate.
Answer
20
Multiply the number of symbols (4) by the number each symbol represents (5): 4 × 5 = 20.
Question 3. In a bar graph, the bar representing the number of students absent in Class 5 is twice the height of the bar for Class 3. If Class 3 had 4 students absent, then Class 5 had _______ students absent.
Answer
8
Since the bar for Class 5 is twice as high, multiply the number of absent students in Class 3 by 2: 4 × 2 = 8.
Question 4. If each tally mark represents 1 vote and 15 tally marks are recorded for a favorite game survey, then the total number of votes is _______.
Answer
15
Each tally mark equals one vote, so the total number of votes equals the number of tally marks.
Question 5. The number of symbols in a pictograph must be multiplied by _______ to find the total if each symbol represents more than one unit.
Answer
the scale
Multiply the number of symbols by the scale to find the total number of units represented.
True or False
Question 1. A bar graph can only have vertical bars.
Answer
False
Bar graphs can have either vertical or horizontal bars, depending on what is being represented.
Question 2. In a pictograph, one symbol can represent multiple units.
Answer
True
A scale in a pictograph allows one symbol to represent multiple units, making it easier to manage larger data.
Question 3. The height of a bar in a bar graph does not need to correspond to the frequency it represents.
Answer
False
The height of a bar in a bar graph must correspond to the frequency to accurately represent the data.
Question 4. A pictograph is useful for representing large amounts of data.
Answer
False
While pictographs are visually appealing, they are not always practical for representing large datasets.
Question 5. The scale in a pictograph does not need to be mentioned.
Answer
False
The scale must be mentioned in a pictograph to clearly show what each symbol represents.
Solve the following
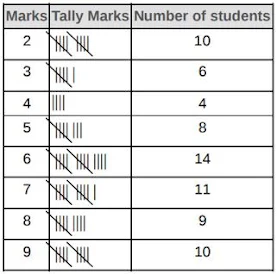
Question 1. Study the following tally marks frequency table and answer the questions given below:

(i) How many students score 10 marks?
(ii) How many students scored above 10?
(iii) How many total students appeared on the test?
Solution
(i) Number of students scored 10 marks = 10
(ii) Number of students scored above 10 marks = 17
(iii) Total number of students who appeared for the test = 27
Question 2. Following are the scores of students of class 3 in a maths test:
12, 12, 14, 15, 16, 18, 13, 15, 16, 17, 18, 13, 16, 20, 20, 19, 17, 15, 12, 15, 16, 17, 18, 18, 19, 20, 16. 19.
Make a tally marks table.
Solution

Question 3. Tim recorded the number of donuts sold over five days.
Read the chart and answer the questions.
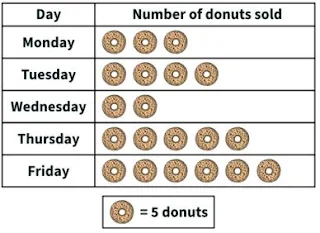
- How many donuts did he sell on Thursday?
- Which day did he sell the least donuts?
- Which day did he sell the most donuts?
- Which day did he sell 20 donuts?
Solution
- Donuts sold on Thursday = 5×5 = 25 donuts
- least donuts were sold on Wednesday
- most donuts were sold on Friday
- Tuesday
Question 3. The pictograph shows how many snowballs each child made. Use the pictograph to answer the given questions.

(i) How many snowballs did Alfredo make?
Answer
There are 3 pictures in front of Alfredo. 1 snowflake represents 4 snowballs made.
So, Alfredo made 3×4 = 12 snowballs.
(ii) How many snowballs did Aaron make?
Answer
There are 2 pictures in front of Aaron. 1 snowflake represents 4 snowballs made.
So, Aaron made 2×4 = 8 snowballs.
(iii) Name two people who made the same number of snowballs.
Answer
Anna and Bailey made the same number of snowballs.
We can simply look at the number of snowflakes in front of each name and see that Anna and Bailey have same number of snowflakes drawn in front of their names.
There are 7 snowflakes which means 7×4 = 28. So, Anna and Bailey, both of them, made 28 snowballs each.
(iv) How many more snowballs did Bailey make than Adeline?
Answer
Bailey made 28 snowballs where as Adeline made 20 snowballs (5x4 = 20)
28 - 20 = 8
Bailey made 8 more snowballs than Adeline.
(v) How many more snowballs did Alexander make than Adora?
Answer
Alexander : 8×4 = 32 snowballs
Adora: 4×4 = 16
32 - 16 = 16
Alexander made 16 more snowballs than Adora.
Question 4. Following are the marks obtained by 72 students in Geography. Arrange these marks in a table using tally marks.
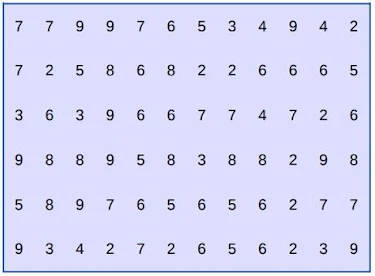
(a) students obtained more than 6 marks.
(b) students obtained marks equal to or below 2.
Answer
Step 1: To count the marks obtained by the students, look at the following tally table:
Step 2: Number of students who scored more than 6 marks Or, the number of students who scored marks 7, 8, 9 = 11 + 9 + 10 = 30 students
Step 3: Number of students who scored marks equal or less than 2 Or, the number of students who scored marks 2 = 10 = 10 students
Question 5. Reena collected the data for the ages (in years) of her hobby class group and she recorded the findings in the manner shown below :

Represent the above data using tally marks in the table below :
|
Ages (in years) |
Tally Marks |
Frequency |
|
8 |
|
05 |
|
9 |
|
|
|
10 |
|
|
|
11 |
|
|
|
12 |
|
|
(i) Find the age that appeared maximum number of times?
(ii) Find the ages that appeared equal number of times.
(iii) How many children are below 11 years?
(iv) How many children are of 10 years or above?
Answer
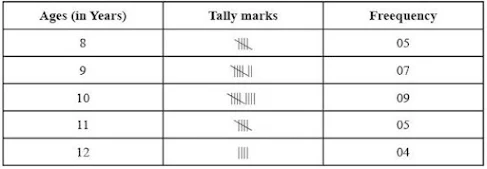
(i) The age that appeared maximum number of times is 10 years.
(ii) 8 years & 11 years of age appeared equal number of times i.e. 5 times.
(iii) The total number of children below 11 years are 5 + 7 + 9 = 21
(iv) The total number of children that are of 10 years and above are 9 + 5 + 4 = 18
Question 6. Following is the pictograph of class VI students. Here 1![]() = 10 boys and 1
= 10 boys and 1![]() = 10 girls. Looking at the pictograph below, answer the following questions.
= 10 girls. Looking at the pictograph below, answer the following questions.
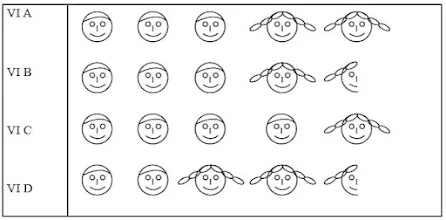
(i) How many students are there in VI A, VI B, VI C and VI D sections each? ______
(ii) Which section has maximum number of boys? _______
(iii) Which section has maximum number of girls? _______
(iv) What is the total strength of class VI? _______
Answer
(i) VI A = 50 students
VI B = 45 students
VI C = 50 students
VI D = 45 students
(ii) Section C has the maximum number of boys.
(iii) Section D has the maximum number of girls.
(iv) Total strength of class VI is 50 + 45 + 50 + 45 = 190 Students
Question 7. The number of students present in class VI during a particular week is given below. It is represented by a pictograph where 1![]() = 6 students.
= 6 students.

(i) On which day maximum students were present? ______
(ii) On which day minimum students were present? ______
(iii) How many students were present on wednesday and Thursday each? _______
Answer
(i) On Saturday maximum students were present.
(ii) On Wednesday minimum students were present.
(iii) 21 students were present on Wednesday and 30 students were present on Thursday.
Question 8. A survey showed the preference of different subjects by students of class VI
|
Subject |
No. of Students |
|
English |
25 |
|
Hindi |
30 |
|
Maths |
50 |
|
Science |
35 |
|
Social Science |
40 |
Draw a pictograph to illustrate the above data taking a scale of 1![]() = 5 students.
= 5 students.
Answer
![]() = 5 students.
= 5 students.

Question 9. The tally chart shows the items sold during the weekends. Use the information from the tally chart to answer the questions.

Find the following:
(a) The sale of is maximum.
(b) Fried rice were sold in all.
Answer
Step 1: First, let us count the tally marks for each item to find the exact number.
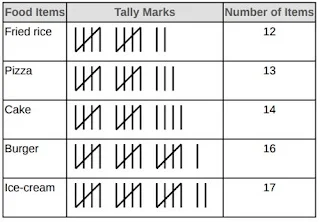
Step 2: Here, we notice that,
(a) Ice-cream have the most count, i.e., 17.
Step 3: (b) Number of Fried rice sold in all = 12
Question 10. The following pictograph shows the number of pears in 6 bags
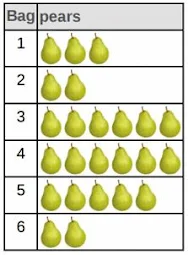
Find the following.
(a) Bag with the maximum number of pears.
(b) Bag with the minimum number of pears.
(c) Total number of pears in all the bags.
Answer
(a) 3 and 4
(b) 2 and 6
(c) 24
Step 1 (a) It is clear from the given pictograph that there are 6 pears in the bags 3 and 4. This is the maximum number of pears in all the bags. Therefore, we can say that the bags 3,4 have the maximum number of pears.
Step 2 (b) It is clear from the given pictograph that there are 2 pears in the bags 2 and 6. This is the minimum number of pears in all the bags. Therefore, we can say that the bags 2,6 have the minimum number of pears.
Step 3 (c) Total number of pears in all the bags = Sum of the pears in all the 6 bags = 3 + 2 + 6 + 6 + 5 + 2 = 24 pears
